Introduction
Code on Github: ELK WordPress SIEM
This tutorial shows how you can setup basic Security Information and Event Management (SIEM) for clusters of Linux servers hosting many WordPress websites.
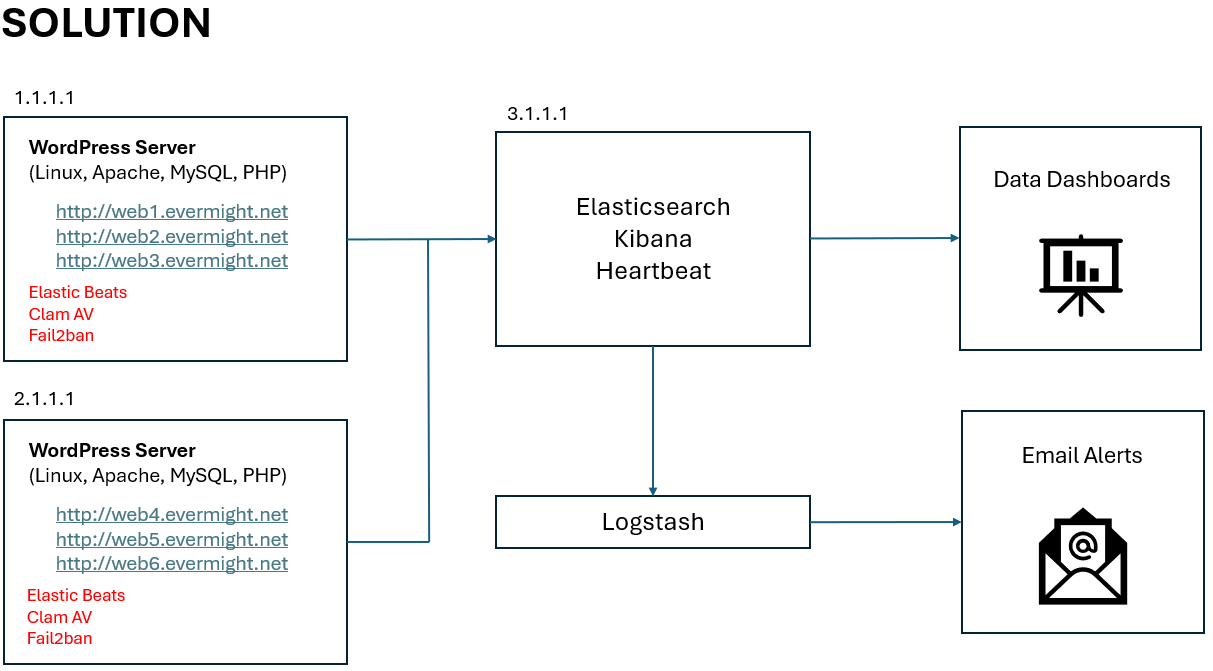
Our solution will use Elasticsearch, Kibana, Logstash, Beats Library, Clam Antivirus and Fail2Ban.
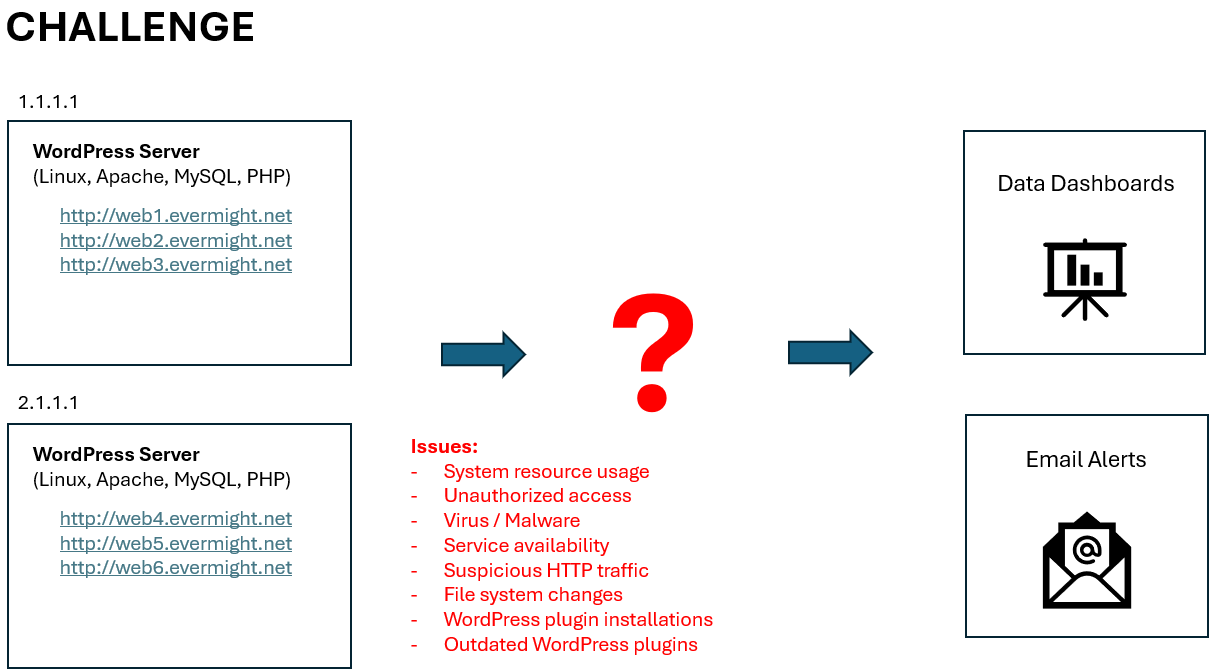
This diagram the infrastructure which we need to upgrade for SIEM.

This diagram shows our goal/solution:

Requirements
In the video, we used 3 Ubuntu 22.04 VM in a cloud service. They had the following specifications:
- Two of the machines had 2 GB memory and 1 CPU. These were used as our WordPress servers.
- One of the machines had 8 GB memory and 2 CPU. This was used as our Elasticsearch server.
The memory and cpu stated are minimum requirements. Some services may fail to install if you have fewer resources, than the minimum.
Steps
Step 0 - Install WordPress
If you already have at least one Wordpres, you can ignore this step. But for reference, here is my WordPress setup. You can skip step if you already have at least one WordPress instance set up. But for reference, I will describe the steps used for my WordPress demonstration (only for demo, not fully secured for production usage).
I created a bashscript called install-wordpress.sh. You can download the script here:
Remember to update the variable ip_server with the IP address of your server. If you use local IP addresses that start with 172. or 192. for testing on a local network, remember to set up the appropriate FQDN records in your /etc/hosts file to ensure URLs map to the IP address of your WordPress server.
Execute the ./install-wordpress.sh to install and configure all the backend services for WordPress.
Go to your browser to visit http://web1.evermight.net, http://web2.evermight.net, and http://web3.evermight.net to complete your setup. You can see the mysql username, password and database names specified in the ./install-wordpress.sh file. At the time of this writing, they are web1, web1-ABCD-pass, web1 respectively. Replace 1 with 2 or 3 for web2 and web3 respectively.
You can repeat these steps for additional servers.
Step 1 - Setup Elasticsearch and Kibana
This step is probably where most people will begin since most people already had Step 0 setup in one way or another.
We need to set up Elasticsearch to store and manage observability and SIEM data coming from our wordpress servers. We have many other guides on how to do this. Here are 2 of the more popular ones which you may be aware of that would also work fine for this video:
- Setup ELK with Self-Signed Certs - Video Explanation & Written Summary
- Setup ELK with Self-Signed Certs with Docker - Video Explanation & Written Summary
We will use a simplified version of the second option since it is easiest for testing purposes. Here are the simplified steps:
Step 1.1 - Configure Ubuntu Server
Let's get Git, Docker, Docker Compose and curl on the server by using these commands:
apt-get update;
apt-get install -y docker docker-compose git curl vim;
Step 1.2 - Run Docker + Elasticsearch Project
We can start Elasticsearch and Kibana by using our Github project here:
Run these commands:
git clone https://github.com/evermight/elk-wordpress-siem.git;
cd elk-wordpress-siem/es;
cp env.sample .env;
docker-compose up --build -d;
NOTE - consider using different passwords in your .env file before running the docker-compose up --build -d.
You can now access Elasticsearch through Kibana by visiting https://[elastic.ip.address]:5601.
Login with the user elastic and the password specified in your .env file.
Optional - Update Hostfile On Work Computer
It can be cumbersome to always type the IP address of the Elasticsearch server into your web browser. We will update the host file of the computer with the web browser such that the hostname kibana maps to the IP address of the Elasticsearch and Kibana server. Henceforth, we will access the Kibana website with https://kibana:5601.
Step 1.3 - Prepare Setup Scripts
We have prepared bash scripts in the directory ~/elk-wordpress-siem/es/scripts to facilitate the integration of Beats, Logstash, WordPress, ClamAV and Fail2ban.
These bash setup scripts make HTTP requests to the Elasticsearch REST API and the Kibana REST API to set up new resources such as user accounts, indices, data views, connectors, visualizations, dashboards, rules etc... If you choose not to use these bash scripts, you can manually configure these through Kibana's web interface.
We will use our setup scripts, to keep things simple and automated.
Before can use them, we need to create a .env file for our setup scripts. The .env file will contain connection details to our instance of Elasticsearch and Kibana. Simply run these commands:
cd ~/elk-wordpress-siem/es/scripts;
cp env.sample .env;
Notice that in our .env file, we already specified ELASTIC_HOST and KIBANA_HOST. You can change these values to point to a completely different instance of Elasticsearch/Kibana. This means everything in this ~/elk-wordpress-siem/es/scripts directory can be re-used for other ELK instances.
For our current use case, we need es01 and kibana to point to 127.0.0.1 which is itself. Add the following lines to the /etc/hosts file of the Elasticsearch server:
echo '127.0.0.1 es01 kibana' >> /etc/hosts;
Once done, you can ping es01 or ping kibana from the terminal window, to see that these hostnames reference the current machine.
You can now use these setup scripts in subsequent steps.
Step 1.4 - Setup Agent User
For security reasons, we do not want to use the existing elastic super user as the account to connect services such as the Beats Library, WordPress, ClamAV, etc... to Elasticsearch. We will create a different user account specified by the AGENT_USER variable in the ~/elk-wordpress-siem/es/scripts/.env file by running this command or script:
cd ~/elk-wordpress-siem/es/scripts;
./setup-step-1.4.sh
You can confirm this user was made by clicking to Kibana > Stack Management > Users.
Step 2 - Setup Beats Library on FIRST WordPress Server
Pick the first WordPress server that you want to install the Beats library to and SSH into it.
Step 2.1 - Update Host File
We need this server to be able to reach the Elasticsearch and Kibana via hostname. So run the following command:
echo "[elastic.ip.address] es01 kibana" >> /etc/hosts
Replace the [elastic.ip.address] with the IP address of the server from Step 1.2.
Step 2.2 - Obtain the Certificate of the CA
You will need to copy TLS certificate of the Certificate Authority created by your Elasticsearch.
On your wordpress server, make a directory for your CA with this command:
mkdir -p /etc/certs/es/
On your Elasticsearch server, get your CA with these commands:
docker cp wp-es01-1:/usr/share/elasticsearch/config/certs/ca/ca.crt /tmp/.
cat /tmp/ca.crt
Copy the contents /tmp/ca.crt contents from your Elasticsearch server into a new file called /etc/certs/es/ca.crt on your WordPress server.
Step 2.3 - Install Beats Library
Install Metricbeat, Filebeat, Auditbeat, Packetbeat on to your WordPress server with these commands:
wget -qO - https://artifacts.elastic.co/GPG-KEY-elasticsearch | sudo apt-key add -;
sudo apt-get install apt-transport-https;
echo "deb https://artifacts.elastic.co/packages/8.x/apt stable main" | sudo tee -a /etc/apt/sources.list.d/elastic-8.x.list;
sudo apt-get update && sudo apt-get -y install metricbeat filebeat auditbeat packetbeat;
Step 2.4 - Update YML Files of Each Beat
Copy over the configuration files found under the ~/es/beats directory of your Elasticsearch directory into your WordPress server. You can run this command from your Elasticsearch server:
cd ~/elk-wordpress-siem/
scp -r ./beats/* root@[wordpress-server]:/etc/
Replace the [wordpress-server] with the ip address of your WordPress server.
Note - In the /etc/metricbeat/modules.d/mysql.yml, make sure the database credentials are correct.
Step 2.5 - Update Beat User - (OPTIONAL)
Optional - In Step 1.3, the ~/elk-wordpress-siem/es/scripts/setup.sh created a new user just for the Beats library to use. The username and password can be seen in the variable AGENT_USER and AGENT_PASS in the file ~/elk-wordpress-siem/es/scripts/.env file. The yml files in Step 2.4 are configured to use the values specified by AGENT_USER and AGENT_PASS. You can modify the yml files to use another user before continuing to the next step.
Step 2.6 - Initialize Elasticsearch to Use Beats - (ONLY ONCE)
Perform this step ONLY ONCE.
To use the Beats Library, we need to configure Elasticsearch with new datastreams, indices, dataviews, pipelines, etc... If these have already been setup by a previous installation of beats used on other servers, then you must skip this step and proceed to Step 2.7.
From you WordPress server, run these commands to configure Elasticsearch and Kibana to use Beats library for the first time:
/usr/share/metricbeat/bin/metricbeat test config -c /etc/metricbeat/metricbeat.yml --path.data /var/lib/metricbeat --path.home /usr/share/metricbeat;
/usr/share/metricbeat/bin/metricbeat test output -c /etc/metricbeat/metricbeat.yml --path.data /var/lib/metricbeat --path.home /usr/share/metricbeat;
/usr/share/metricbeat/bin/metricbeat setup -c /etc/metricbeat/metricbeat.yml --path.data /var/lib/metricbeat --path.home /usr/share/metricbeat;
/usr/share/filebeat/bin/filebeat test config -c /etc/filebeat/filebeat.yml --path.data /var/lib/filebeat --path.home /usr/share/filebeat;
/usr/share/filebeat/bin/filebeat test output -c /etc/filebeat/filebeat.yml --path.data /var/lib/filebeat --path.home /usr/share/filebeat;
/usr/share/filebeat/bin/filebeat setup -c /etc/filebeat/filebeat.yml --path.data /var/lib/filebeat --path.home /usr/share/filebeat;
/usr/share/auditbeat/bin/auditbeat test config -c /etc/auditbeat/auditbeat.yml --path.data /var/lib/auditbeat --path.home /usr/share/auditbeat;
/usr/share/auditbeat/bin/auditbeat test output -c /etc/auditbeat/auditbeat.yml --path.data /var/lib/auditbeat --path.home /usr/share/auditbeat;
/usr/share/auditbeat/bin/auditbeat setup -c /etc/auditbeat/auditbeat.yml --path.data /var/lib/auditbeat --path.home /usr/share/auditbeat;
/usr/share/packetbeat/bin/packetbeat test config -c /etc/packetbeat/packetbeat.yml --path.data /var/lib/packetbeat --path.home /usr/share/packetbeat;
/usr/share/packetbeat/bin/packetbeat test output -c /etc/packetbeat/packetbeat.yml --path.data /var/lib/packetbeat --path.home /usr/share/packetbeat;
/usr/share/packetbeat/bin/packetbeat setup -c /etc/packetbeat/packetbeat.yml --path.data /var/lib/packetbeat --path.home /usr/share/packetbeat;
Next go back to your Elasticsearch server and run these commands to setup remaining elastic resources for SIEM:
cd ~/elk-wordpress-siem/es/scripts;
./setup-step-2.x.sh
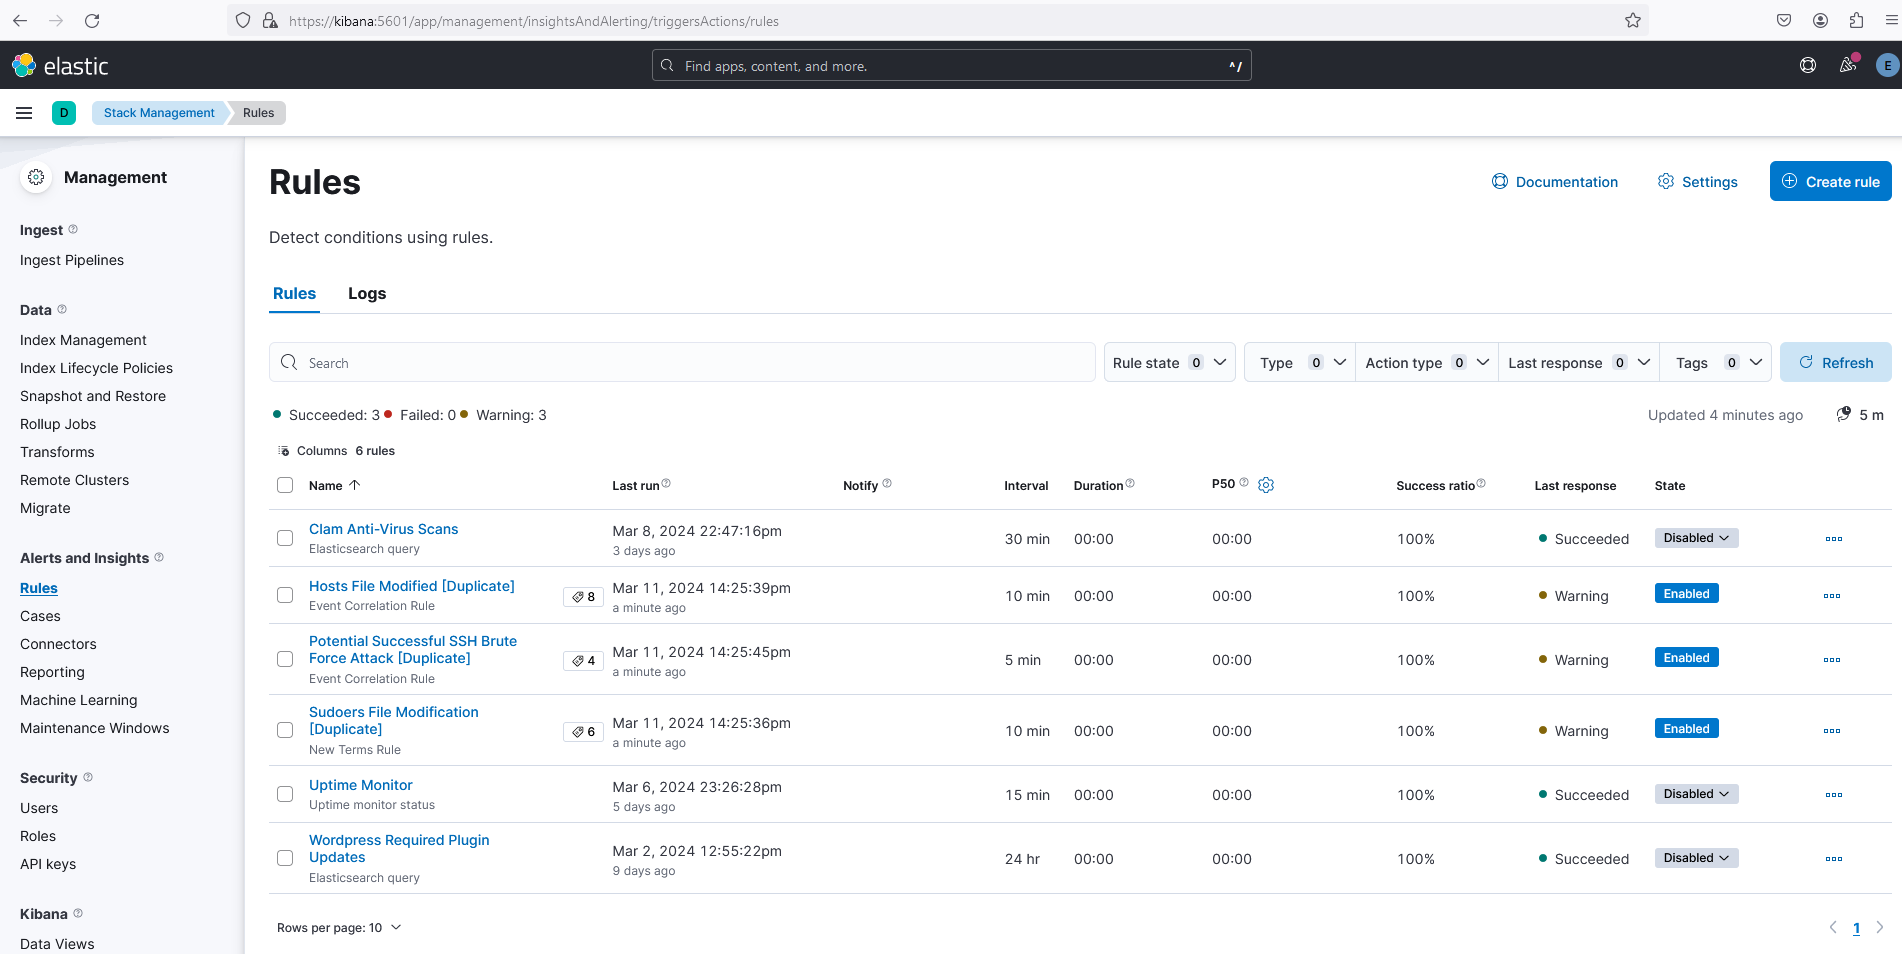
Confirm things are installed by:
- visit Kibana > Stack Management > Rules and
- note existence of many rules such as Clam Anti-Virus Scans, Hosts File Modified [Duplicate] etc...
Here is a screenshot that shows successful set up:

Step 2.7 - Enable and Start Beat Services
Enable and start each of the beat services with these commands:
systemctl enable metricbeat.service;
systemctl enable filebeat.service;
systemctl enable auditbeat.service;
systemctl enable packetbeat.service;
systemctl start metricbeat.service;
systemctl start filebeat.service;
systemctl start auditbeat.service;
systemctl start packetbeat.service;
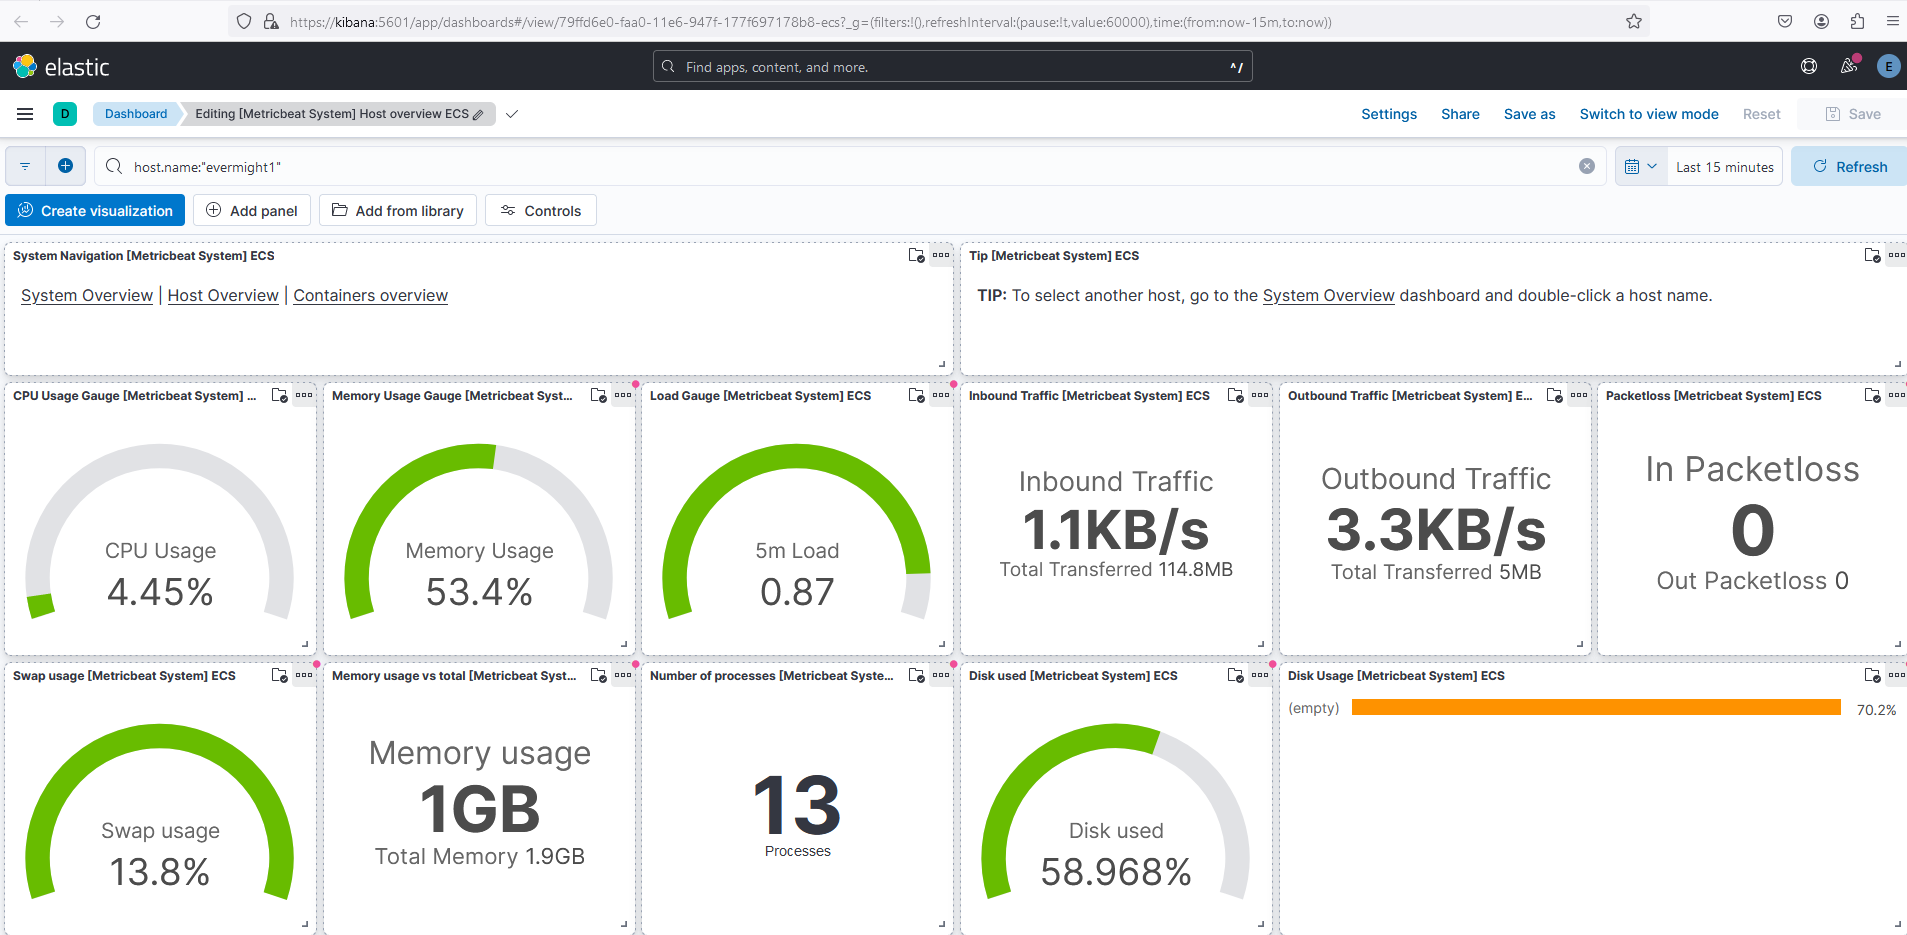
Confirm beats are working by visiting some of the Kibana > Analytics > Dashboards. For example, this screenshot of Kibana > Analytics > Dashboards > Metricbeat Host Overview ECS implies Metricbeat is functioning properly:

Step 2.8 - Capture Outdated WordPress Plugins
We want to be notified whenever a WordPress plugin is out of date on any of our WordPress websites. We have a simple plugin that can ship plugin version information to Elasticsearch that you can install to each wordpress website. The plugin is defined by the file ~/elk-wordpress-siem/wordpress/wp-content/plugins/evermight/evermight.php. Before you copy this file into your WordPress website, open up the file and look at these 3 lines:
define('ES_USER', 'myagent');
define('ES_PASS', 'changeme');
define('PING_INTERVAL', 60*60*12); // minimum number of seconds to wait before next ES submission
The ES_USER, ES_PASS has been automatically hardcoded to the values from Step 1.3. Feel free to change these two values plus the PING_INTERVAL to something that you find more suitable.
When you are ready copy the plugin to your WordPress server:
scp ~/elk-wordpress-siem/wordpress/wp-content/plugins/* root@[wordpress-server]:~/
Replace [wordpress-server] with the IP address of your WordPress server.
On your WordPress server, copy the plugin to each WordPress site and update file permissions:
mkdir wp-plugins/;
mv evermight wp-plugins/;
cp -r wp-plugins/* /var/www/web1/wp-content/plugins;
cp -r wp-plugins/* /var/www/web2/wp-content/plugins;
cp -r wp-plugins/* /var/www/web3/wp-content/plugins;
chown -R www-data:www-data /var/www/web1/wp-content/plugins;
chown -R www-data:www-data /var/www/web2/wp-content/plugins;
chown -R www-data:www-data /var/www/web3/wp-content/plugins;
Login to WordPress Admin > Plugins > Installed Plugins and Activate the Elasticsearch WordPress Plugin Monitor.
Send plugin information to Elasticsearch by visiting each of these URLs in your web browser:
http://web1.evermight.net/?rest_route=/evermight/v1/plugin-check
http://web2.evermight.net/?rest_route=/evermight/v1/plugin-check
http://web3.evermight.net/?rest_route=/evermight/v1/plugin-check
Confirm you received plugin information by visiting Kibana > Dev Tools and running this query:
GET /wp-plugins/_search
Alternatively, you can see plugin details in the Kibana > Discover > wp-plugins.
We will create a dashboard and email alert for outdated WordPress plugins in a later step.
Step 2.9 - Heartbeat - Uptime Monitor and WordPress Plugin Checker
In this step, Heartbeat will ping the WordPress plugin we created in the previous step AND monitor each website for uptime.
In our ~/elk-wordpress-siem/es/docker-compose.yml, we specified a container for Heartbeat. The container will use the configuration file ~/elk-wordpress-siem/beats/heartbeat/heartbeat.yml. You can see that our configuration file will automatically check the ~/elk-wordpress-siem/beats/heartbeat/monitors.d/ directory every few seconds for websites we need to monitor.
To get things started, we already listed http://web1.evermight.net/ to http://web3.evermight.net/. You can add more urls ~/elk-wordpress-siem/beats/heartbeat/monitors.d/wordpress.yml or add a new yml file with new urls. Heartbeat will automatically load the new configurations every few seconds.
We also created an ~/elk-wordpress-siem/beats/heartbeat/monitors.d/wordpress-plugin.yml using similar conventions but it pings the plugin we created in the previous step.
If you are testing locally, you may wish to run a command similar to the below to allow your container to reach your wordpress server via domain names:
docker exec -it wp-heartbeat01-1 bash;
echo '[wordpress-server-ip] web1.evermight.net web2.evermight.net web3.evermight.net' >> /etc/hosts;
exit;
You can review the monitors at Kibana > Observability > Uptime > Monitors. We will set up email alerts in later steps.
Step 2.10 - ClamAV Antivirus
We will install ClamAV anti-virus on the wordpress server so that it can scan the server periodically for viruses and malware. Then we will submit the scan logs to Elasticsearch. In subsequent steps, we will configure Elasticsearch to notify us any time viruses are found.
Install clamav with this command:
apt-get update;
apt-get install -y clamav;
We've prepared some useful scripts for running ClamAV. On your WordPress server, make a new directory:
mkdir ~/clamscans
Copy the files in ~/elk-wordpress-siem/clamscans/* from your Elasticsearch server over to the ~/clamscans directory of your WordPress server.
scp ~/elk-wordpress-siem/* root@[wordpress-server-ip]:~/clamscans/
On your WordPress server, make a .env file:
cd ~/clamscans;
cp env.sample .env;
Edit the connection details of the .env if necessary.
Now you can run the file ~/clamscans/clamscan.sh -d [directory you want to scan] to scan any directory on your server. The scan logs will be available in the ~/clamscans/log/scan.log file and quarantined files will be in the ~/clamscans/q directory.
You can send the results of ~/clamscans/log/scan.log to Elasticsearch by running ~/clamscans/send.sh. The logs will appear in the Elasticsearch index called clamscans. Go to Kibana > Dev Tools to run the query GET /clamscans/_search to see the logs. Alternatively, you can see ClamAV logs the Kibana > Discover > clamscans.
Add the ~/clamscans/scan.sh and ~/clamscans/send.sh to the Cron job of the WordPress server to run these periodically.
Step 2.11 - Install Fail2Ban
We will install Fail2Ban to automatically ban IP addresses that perform suspicious behaviours. We also want to ban an IP address for 5 minutes if they fail 10 times within the last 5 minutes via /wp-login url.
Install Fail2ban with:
apt-get update;
apt-get install fail2ban;
Set up a jail file by copying the template:
cp jail.conf jail.local
You can see that the contents of jail.local references all filters (ie. regex match rules for log files) in the /etc/fail2ban/filters.d directory. We will create one more filter for our failed wordpress login rule and link to it form jail.local.
Create a file called /etc/fail2ban/filters.d/wordpress-login.conf and paste in this content:
[Definition]

badagents =

failregex = ^<HOST> -.*"(GET|POST|HEAD) \/+wp-login.*$
            ^web[0-9]+.evermight.net:80 <HOST> -.*"(GET|POST|HEAD) \/+wp-login.*$

ignoreregex =
Then add this code to our jail.local to create a new jail that bands a user for 5 minutes if they failed to login 10 times within the last 5 minutes:
[wordpress-login]
enabled  = true
logpath  = %(apache_access_log)s
findtime = 300
bantime  = 300
maxretry = 10
Start Fail2ban
systemctl enable fail2ban;
systemctl start fail2ban;
You can test the rule by trying 10 failed login attempts to see if your IP address gets banned.
You can review the banned ips with the command fail2ban-client status wordpress-login.
You can unban ip addresses with this command fail2ban-client set YOURJAILNAMEHERE unbanip IPADDRESSHER;
Note - You can also run the iptables -S command to review how Fail2ban has updated your underlying IPTables.
Step 3 - Setup Additional WordPress Servers
To create more WordPress servers, repeat Step 2.1 to Step 2.13 but skip Step 2.6.
Replace web1.* to web3.* and any mention of [wordpress-server-ip] with the IP address of your next WordPress server.
Step 4 - Review Useful Beats Dashboards
The beats library comes with many useful dashboards. Here are some of the most notable ones under Kibana > Dashboards:
Apache:
- [Filebeat Apache] Access and Error Logs ECS
- [Metricbeat Apache] Overview ECS
MySQL:
- [Filebeat MySQL] Overview ECS
- [Metricbeat MySQL] Database Overview
Operating System:
- [Filebeat System] Syslog dashboard ECS - Contains links to other related dashboards
- [Metricbeat System] Host overview ECS - Contains links to other related dashboards
- [Auditbeat System] System Overview ECS - Contains links to other related dashboards
- [Auditbeat File Integrity] Overview ECS
- [Auditbeat Auditd] Overview ECS
- [Filebeat Iptables] Overview ECS
Step 5 - Enable Rules and Email Alerts
Go to Kibana > Stack Management > Rules and enable any rule you like. Then try to trigger some of those rules.
If you want email alerts, update the SMTP_* variables in the ~/elk-wordpress-siem/es/.env file and docker restart wp-logstash01-1.
If you want to run Logstash from host machine with out docker, copy the files ~/elk-wordpress-siem/logstash/logstash/* to /etc/logstash/ of your host machine. Create a .env from the env.sample file. Then run Logstash using the command shown in /etc/logstash/run.sh.
